Difference between revisions of "Debugging and Console"
Mark Thomas (talk | contribs) |
|||
| (One intermediate revision by one other user not shown) | |||
| Line 2: | Line 2: | ||
<span style="color:red">This page should be continually expanded upon, if you can add something to this page, please do!</span> | <span style="color:red">This page should be continually expanded upon, if you can add something to this page, please do!</span> | ||
[[File:Console.cf6a0456.png|thumb|Console display]] | |||
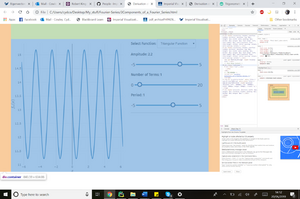
In Python, debugging is easy - you press play, and if there is an error in the code, your interpreter tells you precisely what and where it is. For web development, debugging is a little trickier, but the golden rule is F12 (or fn+F12 for some keyboards) is your best friend! This hotkey (or right-click + inspect for mac) brings up the browser developer tools, composed of several tabs. Of these, the elements tab is essentially your HTML/CSS debugger. If you hover over the HTML brought up in this tab, the div will be highlighted on the actual web page. Here we can see the div and its corresponding padding highlighted on the page when the container div is hovered over: | In Python, debugging is easy - you press play, and if there is an error in the code, your interpreter tells you precisely what and where it is. For web development, debugging is a little trickier, but the golden rule is F12 (or fn+F12 for some keyboards) is your best friend! This hotkey (or right-click + inspect for mac) brings up the browser developer tools, composed of several tabs. Of these, the elements tab is essentially your HTML/CSS debugger. If you hover over the HTML brought up in this tab, the div will be highlighted on the actual web page. Here we can see the div and its corresponding padding highlighted on the page when the container div is hovered over: | ||
| Line 8: | Line 8: | ||
The second important tab to know about is the console tab. This is essentially your JavaScript debugger. Any error reports in your JS code will pop up here in red, and if you click on the error, it should take you to the JS code where the error was found. Also, the analogy to the python print(“hello world”) in JS is console.log(“hello world”), where the printed output should appear in the console tab. However, when you have finished your debugging, it is very important to remove all console.log commands, so they do not stay in your page's live version! | The second important tab to know about is the console tab. This is essentially your JavaScript debugger. Any error reports in your JS code will pop up here in red, and if you click on the error, it should take you to the JS code where the error was found. Also, the analogy to the python print(“hello world”) in JS is console.log(“hello world”), where the printed output should appear in the console tab. However, when you have finished your debugging, it is very important to remove all console.log commands, so they do not stay in your page's live version! | ||
[[Category:Tips Whilst Coding]] | |||
Latest revision as of 15:46, 27 September 2021
In Python, debugging is easy - you press play, and if there is an error in the code, your interpreter tells you precisely what and where it is. For web development, debugging is a little trickier, but the golden rule is F12 (or fn+F12 for some keyboards) is your best friend! This hotkey (or right-click + inspect for mac) brings up the browser developer tools, composed of several tabs. Of these, the elements tab is essentially your HTML/CSS debugger. If you hover over the HTML brought up in this tab, the div will be highlighted on the actual web page. Here we can see the div and its corresponding padding highlighted on the page when the container div is hovered over
This page should be continually expanded upon, if you can add something to this page, please do!
In Python, debugging is easy - you press play, and if there is an error in the code, your interpreter tells you precisely what and where it is. For web development, debugging is a little trickier, but the golden rule is F12 (or fn+F12 for some keyboards) is your best friend! This hotkey (or right-click + inspect for mac) brings up the browser developer tools, composed of several tabs. Of these, the elements tab is essentially your HTML/CSS debugger. If you hover over the HTML brought up in this tab, the div will be highlighted on the actual web page. Here we can see the div and its corresponding padding highlighted on the page when the container div is hovered over:
The second important tab to know about is the console tab. This is essentially your JavaScript debugger. Any error reports in your JS code will pop up here in red, and if you click on the error, it should take you to the JS code where the error was found. Also, the analogy to the python print(“hello world”) in JS is console.log(“hello world”), where the printed output should appear in the console tab. However, when you have finished your debugging, it is very important to remove all console.log commands, so they do not stay in your page's live version!
