Difference between revisions of "Mathematical induction games"
DenizAydin (talk | contribs) (Add the graphical blueprint) |
DenizAydin (talk | contribs) (Add link to the Beetle and Cactus demonstration) |
||
| Line 51: | Line 51: | ||
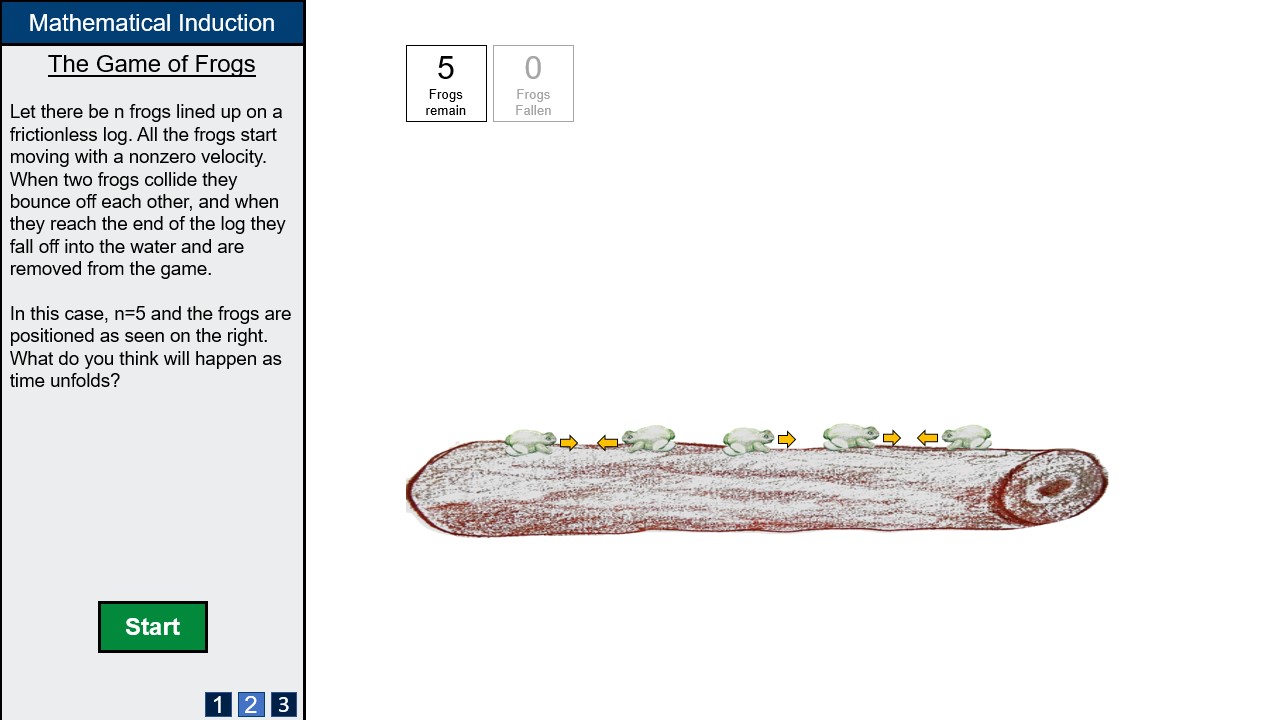
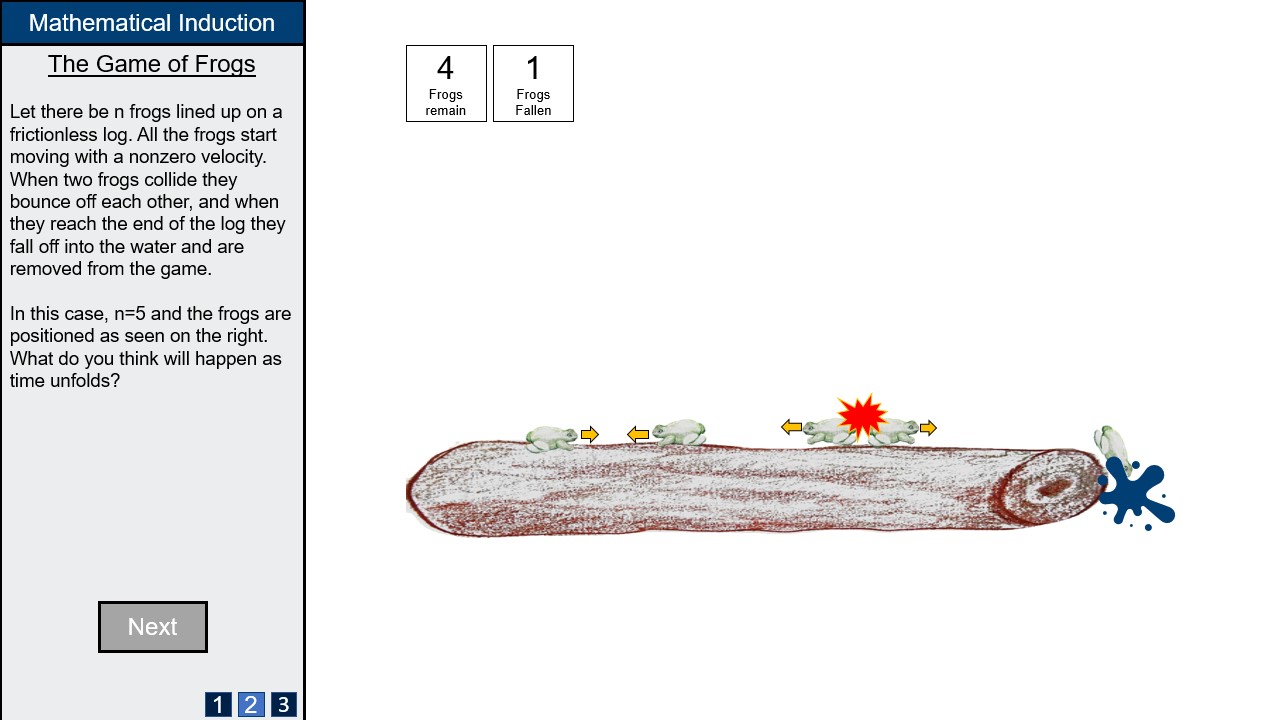
[[File:FrogGameSlide3.jpg|none|frame|Clicking the start button begins the animation, which runs until all frogs fall off. The user is then asked to consider whether this happens in general before moving on to the next page.]] | [[File:FrogGameSlide3.jpg|none|frame|Clicking the start button begins the animation, which runs until all frogs fall off. The user is then asked to consider whether this happens in general before moving on to the next page.]] | ||
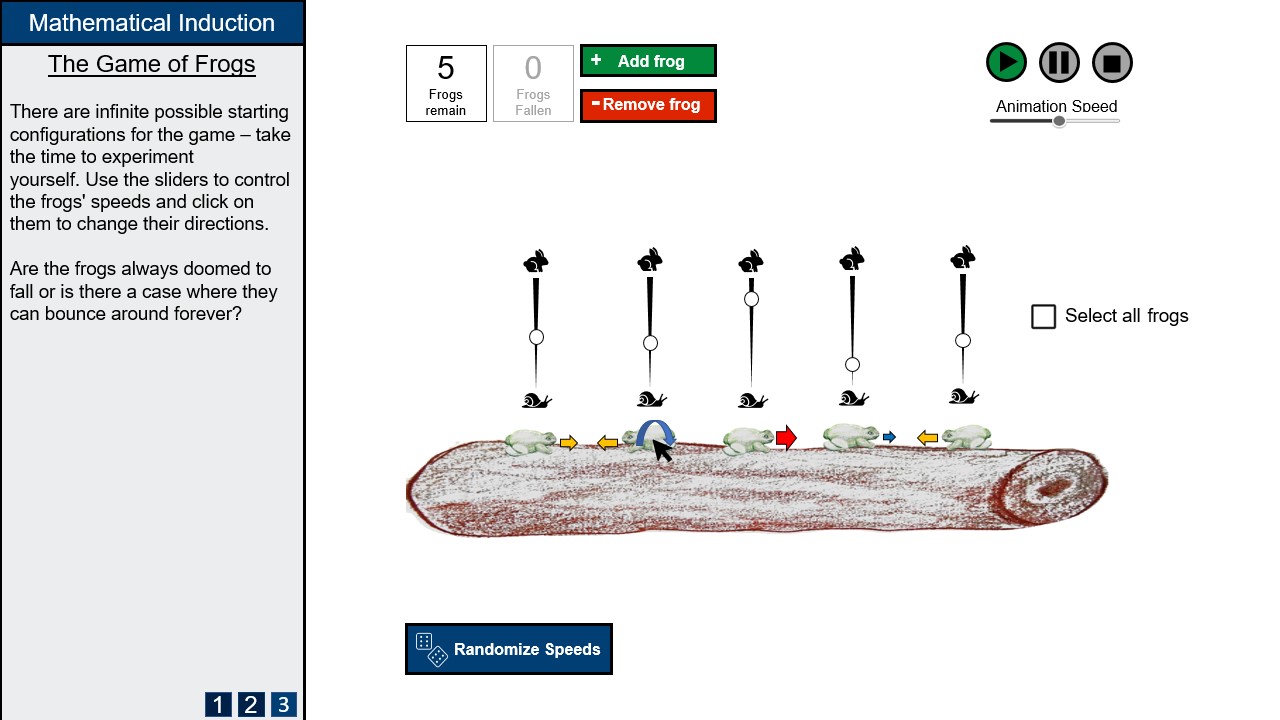
[[File:FrogGameSlide5.jpg|none|frame|Page 3 is the main visualisation. Users can change the number of frogs, the speed and direction of each individual frog and then observe the results.]] | [[File:FrogGameSlide5.jpg|none|frame|Page 3 is the main visualisation. Users can change the number of frogs, the speed and direction of each individual frog and then observe the results.]] | ||
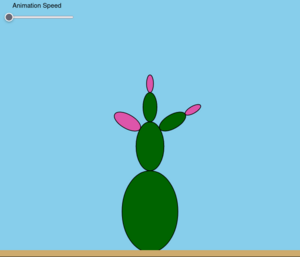
[[File:Beetle and Cactus1.png|thumb|Screenshot of the inital configuration.]] | |||
=== The Beetle and the Cactus === | |||
==== [https://editor.p5js.org/denayd/full/NdbfTJNmc Link to prototype] ==== | |||
''(Note: this link is live so functionality may break or change as I work on it. Reported not to work on some (Kelly's) browsers, should be fine on mobile now though)'' | |||
Click on the leaf (pink) segments and watch the magic! Code can be seen by clicking the button in the top right. | |||
==Design Justification== | ==Design Justification== | ||
Revision as of 22:08, 1 December 2021
This is a template which you can use to help get you started on the wiki submission. It is just intended as a guide and you may modify the structure to suit your project.
Contributors
- Zerui Qian, Department of Physics, Student partner from October 2021
- Kelly Chang, Department of Medical Biosciences, Student partner from October 2021
- Max Bingham, Department of Physics, Student partner from October 2021
- Deniz Aydin, Department of Mathematics, Student partner from October 2021
- Mark Wheelhouse, Department of Computing. Staff partner from October 2021.
Staff Partner's Brief
1. Visualising "The Game of Frogs"
This is a thought experiment to get students thinking about Mathematical Induction. We would like to have a visualisation for this little game that will allow the students to experiment with the idea (number of frogs, starting speeds, etc).
The core learning outcome here is that a student should be able to provide an inductive argument to answer why all of the frogs will eventually fall off of the plank.
2. Visualising "The beetle and the cactus".
This is a thought experiment to get students thinking about Mathematical Induction. We would like to have a visualisation for this scenario that will allow the students to experiment with the idea (e.g. initial cactus set-up and beetle's rules). The core learning outcome here is that a student should be able to provide an inductive argument to show why the beetle can (and will) eventually consume the whole cactus. This thought experiment has also been referred to as "Hercules and the Hydra" and has an existing online visualisation.
"I'd be happy with the students only tackling one of these two visualisations (not that I would be unhappy if they did both!)" - Mark
Aims & Learning Outcomes
- Explain the motivation for your visualisation.
- Introduce the subject of your visualisation.
- Which module and year is it intended for and which setting (lecture or self study)?
- List learning outcomes. E.g.: "After using this visualisation, students should be able to explain that..."
These two game visualisations will be shown during a lecture of COMP400018 - Discrete Mathematics, Logic and Reasoning. They will also be available for self-study so that students can validate what we have discussed in the lecture.
The two thought experiments are intended as playgrounds for developing an intuition for mathematical induction. Mathematical Induction is a technique for proving statements about a class of mathematical objects. The core idea is that if a statement is true for the first object in a sequence, and it being true for one object means that it is true for the next, then the statement must be true for all objects in the sequence. This can later be generalised to "structural induction", where the objects need not form a linear sequence but instead can be a part of any recursively defined structure, such as a tree.
The first thought experiment is "The Game of Frogs", where n frogs slide back and forth on a 1-dimensional frictionless log. If two frogs collide, they bounce off eachother, and if they reach the end of the log they fall into the water and are removed from the game. It seems obvious that each frog must eventually fall into the water, but how can one prove this? After the lecture, the students should be able to provide such an inductive argument.
The second is "The Beetle and the Cactus". A beetle is attempting to eat a cactus which has a tree structure, where every segment can have other segments branching off of it. When it eats one of the outermost "leaf" segments the segment immedietly before it gets duplicated, along with every one of it's descendents. The question is whether or not the beetle can finish off the whole cactus. At first the cactus appears to grow exponentially making the task seem impossible, but the surprising fact is that not only can the beetle eat the whole cactus regardless of the starting configuration, it cannot be avoided so long as it keeps eating. The inductive argument here is more complicated, as the cactus can get bigger before it gets smaller. Because of this a a complete proof is not expected from the students, but it would be nice for them to be able to describe a rough overview of how such an argument would work.
For our visualisation, Mark has stated that it is not strictly necessary for the inductive arguments to be explained within the visualisation for them to be of use in his lecture. The main intent is for the visualisation to make the abstract thought experiments more real for the students to play with and the teaching will be done around them. Our designs will at least have self contained instructions for use, but we may consider including an overview of the inductive arguments.
Design Overview
We provide:
- A blueprint for a visualisation of "The Game of Frogs", suitable for use in lectures or as a self-contained learning tool. Educational, Graphical, and Interaction design factors have been considered.
- A javascript prototype for "The Beetle and the Cactus" tackling some of the technical problems involved in visualising this thought experiment.
The Game of Frogs
In The Game of Frogs, you swim or you die.
The Beetle and the Cactus
Link to prototype
(Note: this link is live so functionality may break or change as I work on it. Reported not to work on some (Kelly's) browsers, should be fine on mobile now though)
Click on the leaf (pink) segments and watch the magic! Code can be seen by clicking the button in the top right.
Design Justification
Assessment Criteria
- List your cohort's assessment criteria. You may want to number the assessment criteria so you can refer to them easily later.
Education Design
- What Methods were considered to convey concepts?
- Design progression, key choices with justifications.
- How has feedback been incorporated.
Graphical Design
- How were accessibility issues considered?
- How was space used effectively?
- Design progression, key choices with justifications.
- How has feedback been incorporated.
- How is the design intuitive?
Interaction Design
- Choice of interactive element(s) that fit in organically with the visualisation [inspiration of choice might be from lecture/in-class activity or other sources] - Sliders/Buttons/Cursor (hover/click).
- Keeping accessibility of interactive elements in mind during design phase.
- Design progression, key choices with justifications.
- How has feedback been incorporated.
System Icons: The menu button on the top left corner closes or opens the education interface so that users can choose to focus on the game or read the text. Buttons that starts, pauses, resets, and closes the game are located at the upper left corner of the visualisation section. The icons used are universal and intuitive so no labels are added. Initially, the start, pause, and reset buttons are grey. After the user clicks on "Go" in the education section, start button turns green and the "show instructions" button appears. Clicking on the "show instructions" button will play all animation demos for how to control the parameters, whereas clicking on the start button changes its color back to grey and hides the "show instructions" button. When the game starts, pause button becomes yellow and clicking on it changes the pause button to play button. After the game ends (i.e. all frogs fall off the log), the reset button turns blue and clicking on it returns all parameters to their default values.
Number of frogs: A frog counter is located at the upper left corner of the visualisation section. There are three boxes labeled as "Total", "Remaining" and "Fallen", representing total number of frogs, number of frogs on the log, and number of frogs fallen off the log respectively. Users can initialise the total number of frogs themselves using the controller on the left side of the box labeled as "Total" and see how this parameter affects the performance of the game. If users do not have a number in mind, they can click on the button that randomises total number of frogs, which is below all the boxes. The other two boxes only keeps track and starts updating after the game starts.
Speed of frogs: Users can use the buttons on the upper right corner of the visualisation section to choose the distribution they want for the speed of frogs. There are three distributions from which users can choose: random, uniform, and Gaussian. Only one of the distributions can be chosen. If users click on another distribution, the previous distribution will be unselected automatically. If users want to manually assign speed to a specific frog, they can hover their cursor onto the frog and a speed slider will appear. In addition, clicking on the frog will flip its direction.
Progress and Future Work
- Is the design finalised?
- Which pages have been uploaded to website?
- Any ideas for future improvements.
Links
- Link to GitHub repository for code in development:
- Link to visualisation on ImpVis website (when uploaded):
- Link to Collection on ImpVis website (when created):
- Any other links to resources (Miro boards / notes pages / Google Docs etc):


